Visualizations Overview
VizRob presents several visualizations to understand based-behavior robots. Each of the visualizations are accessible via tabs at the top of VizRob.
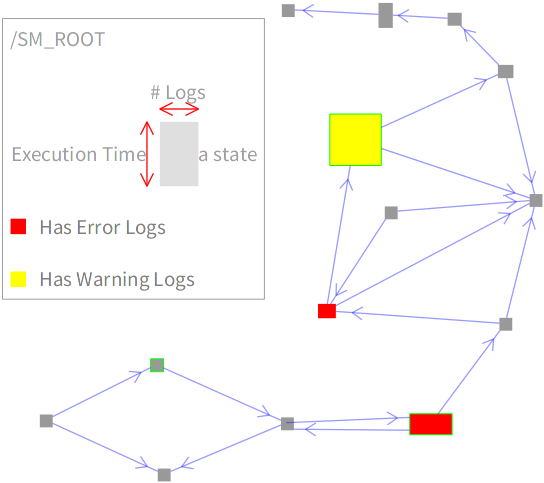
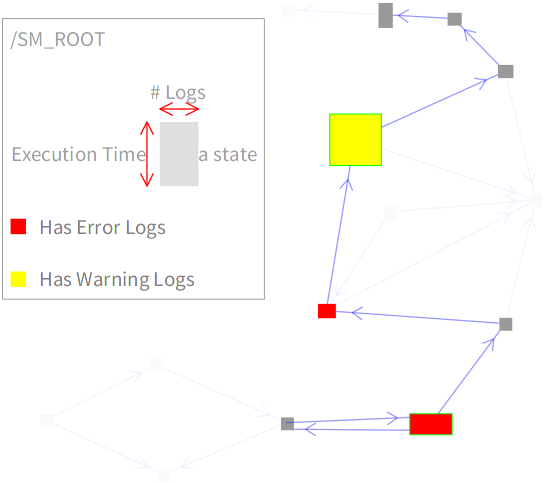
In all visualizations, states are represented as a box to which metrics are vertically and horizontally mapped: the height of a box represents the execution time, and the width represents the number of logs produced on that state.
Moreover, each of the visualizations are interactive in nature: you can click on the elements of the visualization to see more detailed information of that specific element. For example, clicking on a state with a nested machine reveals the nested structure. In this new section, you can again see all the VizRob visualizations on their tabs, but now they are specific to the clicked state.
You can keep going deep in your behavior. With this, you won’t miss any details of what your robot is doing!
Types of Logs
The types of logs visualization associates states to the severity of anomalies found in the logs. In this visualization, states are yellow when there is at least one warning log produced in that state. States with at least one error log are red. When there are warnings and errors logs in the state, red has priority over the yellow. The default color for no warning or error log is gray.
In this example you see at least three important states, which one should we analyze first?
Error Logs
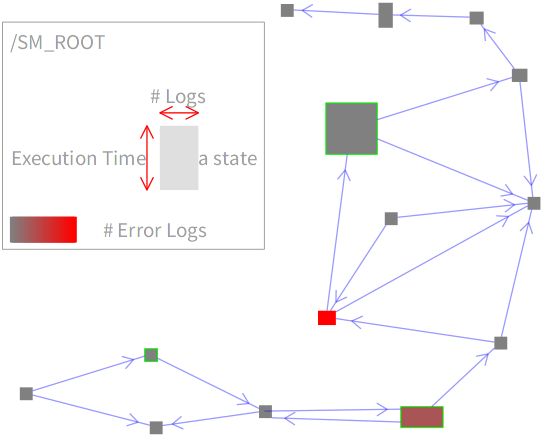
In this visualization, the number of log errors emitted from the execution of a state is linearly mapped to a gray-to-red fading. A red box indicates the state that emitted the largest number of error logs, while a gray state is the state with the least number of error logs.
Now we notice the small red state has more errors rather than the big red state, we have to analyze it!
Frequency
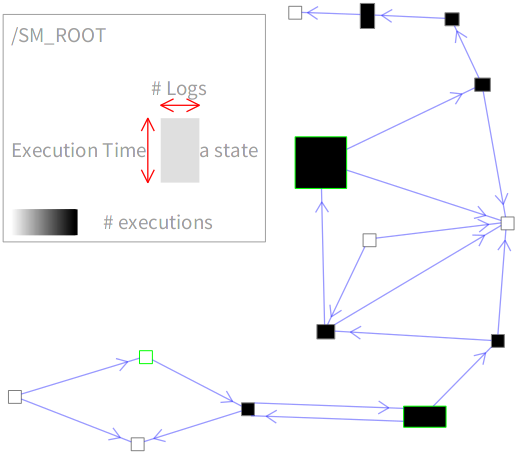
The frequency visualization represents the number of times a state is executed using a white-to-black fading. A state is colored black if has many executions and it is colored light-gray with very few executions.
Did you notice the black states are the same from the coverage visualization?
Coverage
For every visualization, there is an option to turn on and off the coverage of the execution The coverage option only shows states that were executed in the behavior. As you can see, the robot executed just few states.
Logs & Sources
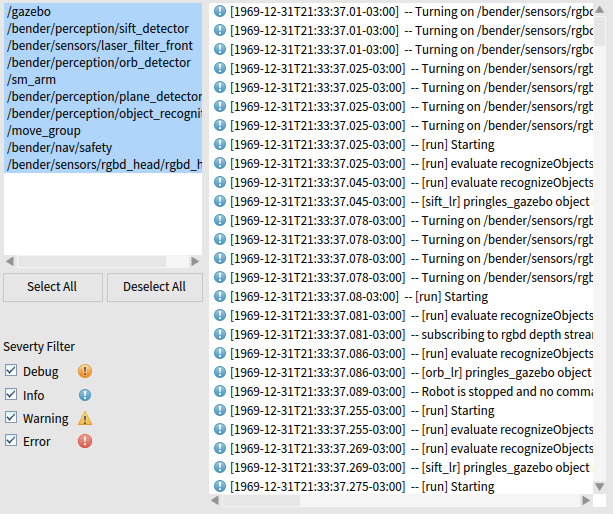
Finally, clicking on a state lists all the logs associated to the state. The list of logs offers the classical navigation and filtering options found in common debug tools.
VizRob also offers a listing of the sources where logs are produced. The source of a log is represented by the line of code in the program where the log is produced. This visualization is similar to the log visualization.
Here there are a lot of info logs, maybe we should filter them out from the listing to see the warning and error logs?
